Інформація призначена тільки для фахівців сфери охорони здоров'я, осіб,
які мають вищу або середню спеціальну медичну освіту.

Підтвердіть, що Ви є фахівцем у сфері охорони здоров'я.


Коморбідний ендокринологічний пацієнт

Коморбідний ендокринологічний пацієнт

Международный эндокринологический журнал Том 18, №5, 2022

Вернуться к номеру

Об’єм щитоподібної залози і частота тиреоїдних вузлів у пацієнтів з порушенням глікемії натще і цукровим діабетом 2-го типу

Авторы: V.I. Pankiv (1), T.Yu. Yuzvenko (1), I.V. Pankiv (2)
(1) — Ukrainian Scientific and Practical Center of Endocrine Surgery, Transplantation of Endocrine Organs and Tissues of the Ministry of Health of Ukraine, Kyiv, Ukraine
(2) — Bukovinian State Medical University, Chernivtsi, Ukraine

Рубрики: Эндокринология

Разделы: Клинические исследования

Версия для печати


Резюме

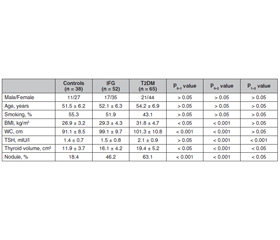
Актуальність. Взаємозв’язок між інсулінорезистентністю й наявністю вузлів щитоподібної залози не з’ясований. Інсулінорезистентність асоціюється зі збільшенням об’єму щитоподібної залози й поширеністю тиреоїдних вузлів у пацієнтів з метаболічним синдромом. Зазвичай метформін у пацієнтів із цукровим діабетом 2-го типу (ЦД2) може впливати на функцію і морфологію щитоподібної залози. Дані про взаємозв’язок морфологічних змін щитоподібної залози з порушенням вуглеводного обміну обмежені. Мета: проспективне дослідження було проведено для оцінки порушення глікемії натще (ПГН) і ЦД2 як факторів ризику збільшення об’єму щитоподібної залози й поширеності вузлів у йододефіцитному регуоні. Матеріали та методи. Проведено проспективне дослідження типу «випадок — контроль» у пацієнтів із ПГН і ЦД2. Дані були зібрані щодо всіх пацієнтів з нещодавно діагностованими ПГН і ЦД2 упродовж періоду із січня 2018 року до грудня 2020 року. 65 пацієнтів із ПГН і 52 пацієнти з ЦД2 були рандомізовані за віком, статтю і статусом куріння з 38 суб’єктами з нормальним вуглеводним метаболізмом. Усім учасникам проводили визначення тирео­тропного гормону (ТТГ) і ультразвукове дослідження щитоподібної залози. Результати. Середній рівень ТТГ у групі ЦД2 (2,1 ± 0,9 мМО/л) був вірогідно вищим, ніж у контрольній групі (1,4 ± 0,7 мМО/л) і групі з ПГН (1,5 ± 0,8 мМО/л) (P < 0,001 для обох). Рівні автоантитіл до щитоподібної залози перебували в межах референсних значень й істотно не відрізнялися між трьома групами. Середній об’єм щитоподібної залози був вірогідно вищим у групах з ПГН (16,1 ± 4,2 см3) і ЦД2 (19,4 ± 5,2 см3), ніж у контрольній групі (11,9 ± 3,7 см3). У групі ЦД2 спостерігалася позитивна кореляція між ТТГ та ІМТ (r = 0,43; p < 0,01), а також між ТТГ і окружністю талії (r = 0,37; p < 0,01). Відсоток пацієнтів із вузлами щитоподібної залози також був вищим у групах з ПГН (46,2 %) і ЦД2 (63,1%), ніж у контрольній групі (18,4 %). Висновки. У пацієн­тів з порушенням глікемії натще і цукровим діабетом 2-го типу вірогідно збільшені об’єм щитоподібної залози й поширеність тиреоїдних вузлів порівняно з контрольною групою.

Background. The relationship between insulin resistance and thyroid nodules is not clearly understood. Insulin resistance is associated with increased thyroid volume and nodule prevalence in patients with meta­bolic syndrome. Metformin commonly used in patients with type 2 diabetes mellitus (T2DM) might possibly alter thyroid function and morphology. Data on the association of thyroid morphology and abnormal glucose metabolism are limited. This prospective study was carried out to evaluate impaired fasting glucose (IFG) and T2DM as a risk factor for increased thyroid volume and nodule prevalence in iodine-deficient area. Materials and methods. This was a prospective case-control study in patients with IFG and T2DM. Data were gathered on all patients newly diagnosed with IFG and T2DM between January 2018 and December 2020. Sixty-five patients with IFG and 52 people with T2DM were randomly matched for age, gender, and smoking habits with 38 subjects with normal glucose meta­bolism. Serum thyroid-stimulating hormone (TSH) was evaluated, and thyroid ultrasonography was performed in all participants. Results. Mean TSH level in the T2DM group (2.1 ± 0.9 mIU/l) was significantly higher than in controls (1.4 ± 0.7 mIU/l) and in the IFG group (1.5 ± 0.8 mIU/l) (p < 0.001 for both). Thyroid autoantibody levels were within normal limits and did not differ significantly between 3 groups. Mean thyroid volume was significantly higher in the IFG (16.1 ± 4.2 cm3) and T2DM groups (19.4 ± 5.2 cm3) compared to controls (11.9 ± 3.7 cm3). In the T2DM group, there was a positive correlation between TSH and body mass index (r = 0.43; p < 0.01), and between TSH and waist circumference (r = 0.37; p < 0.01). The number of patients with thyroid nodules was also higher in the IFG (46.2 %) and T2DM groups (63.1 %) than in controls (18.4 %). Conclusions. The results suggest that patients with impaired glucose metabolism and type 2 diabetes mellitus have significantly increased thyroid volume and nodule prevalence.


Ключевые слова

цукровий діабет 2-го типу; порушення глікемії натще; вузол щитоподібної залози; об’єм щитоподібної залози

type 2 diabetes mellitus; impaired fasting glucose; thyroid nodule; thyroid volume

Introduction

There are multiple well-known etiologic factors for thyroid volume increase and nodule formation including iodine deficiency, and genetic factors [1]. The relationship between insulin resistance (IR) and thyroid nodules is not clearly understood [2]. Increased thyroid volume and nodule prevalence were reported in patients with insulin resistance (IR) [2, 3]. 
IR is one of the fundamental defects associated with impaired glucose metabolism and final progression to type 2 diabetes mellitus (T2DM). Although many studies were conducted in type 1 DM, the reported clinical data about the association of impaired fasting glucose (IFG) and T2DM with the thyroid gland function and morphology are scarce [4, 5]. In these reports, patients with already established diagnosis were included, which preclude any definitive conclusion regarding the sole influence of the T2DM on thyroid morphology and function. Also, commonly used metformin and frequently employed procedures such as exposure to iodinated contrast material in this patient group might possibly alter thyroid function and morphology [6]. Up to now, no study was performed to evaluate thyroid morphological alterations in patients with newly diagnosed IFG and T2DM in iodine deficient area. 
The purpose of our study was to examine whether diagnosis of impaired fasting glucose and type 2 diabetes mellitus is associated with thyroid functional and morphological changes. 

Materials and methods 

This was a prospective case-control study in patients with IFG and T2DM. The Ukrainian Scientific and Practical Center of Endocrine Surgery, Transplantation of Endocrine Organs and Tissues Ethics Committee for Human Studies approved the protocol. All participants provided informed consent. 
Euthyroidism was defined as TSH (reference range, 0.35–4.0 mIU/l) within the normal reference range. The diagnostic criteria proposed by the American Diabetes Association have been used for the definition of IFG and T2DM [7]. 
Newly diagnosed 65 patients with type 2 DM and 52 patients with IFG who attended for regular follow-up at the Ukrainian Scientific and Practical Center of Endocrine Surgery, Transplantation of Endocrine Organs and Tissues and Endocrinology Department of Bukovinian State Medical University between January 2018 and December 2020 were consecutively recruited in the study. 
As a control group, 38 euthyroid control subjects with normal glucose metabolism were recruited from patients admitted to out-patient clinic and they did not have any known acute or chronic illness. The inclusion criteria were ages 35 to 60 years. The controls were matched according to age, gender, and smoking habits with the cases in that manner. Subjects with a history of thyroid disease, overt or subclinical hyperthyroidism and hypothyroidism, previous-thyroxine suppression therapy at any time, iodinated contrast material exposure in the previous 6 months, high thyroid autoantibody titers or history of neck irradiation or surgery were excluded from the study. Patients were also excluded if they exhibited endocrine obesity, pregnancy and lactation, hepatic or renal dysfunction, and history of heart failure or significant neurological or psychological illness (depression, epilepsy, schizophrenia) that will have an impact on thyroid function tests. 
Waist circumference (WC) was measured with a folding tape at the natural waistline in a horizontal plane. Body mass index (BMI) was obtained by dividing the body weight (kg) to the square of height (m). 
Ukraine is moderately iodine-deficient area without mandatory iodization (average urinary iodine concentration (83 μg/l) [8]. 
Thyroid ultrasonography was performed using a 10-MHz linear probe. Volumes of thyroid glands and nodules were calculated according to the ellipsoid formula. Each venous sample was drawn after a minimum fasting period of 12 h. Thyroid function was evaluated by measuring thyroid-stimulating hormone (TSH) using immunochemiluminescent assays by an automated analyzer. Thyroid antibodies [antithyroid peroxidase (normal range: < 50 U/ml) and antithyroglobulin (normal range: < 40 U/ml)] were measured by immunochemiluminescent assays employing commercial kits. Serum glucose was measured by the glucose oxidase technique. 
Statistical analysis. All continuous data were expressed as the mean ± SD. Data were analyzed with SPSS software (Statistical Package for the Social Sciences, version 17.0, SSPS, Chicago). Statistical comparisons were performed by means of independent-samples t tests for data with a normal distribution and χ2 tests for percentages. Continuous variables were analyzed by using one-way ANOVA or Kruskal-Wallis, where appropriate. Pairwise comparisons were made by use of Mann-Whitney U test with Bonferroni correction. Pearson’s correlation test was performed for correlation analysis. Multiple linear regression analysis was used for the assessment of independent predictors of thyroid volume. Predictors of the presence of thyroid nodule were assessed by multivariate binary logistic regression analysis. A p < 0.05 value was considered statistically significant. 

Results

Study population characteristics are depicted in Table 1. As noted, the study included 65 persons with IFG, 123 patients with T2DM, and 38 subjects with normal glucose metabolism as a control group. There was no significant difference when gender, age, and smoking habits were considered (Table 1). BMI and waist circumference were significantly higher in the IFG and T2DM groups than in the control group (P < 0.001 for both). There was no significant difference between the IFG and T2DM groups regarding BMI and WC.
As shown in Table 1, mean TSH level in the T2DM (2.1 ± 0.9 mIU/l) group was significanly higher than the control group (1.4 ± 0.7 mIU/l) and the IFG group (1.5 ± 0.8 mIU/l) (P < 0.001 for both). Thyroid autoantibody levels were within normal limits and did not differ significantly between the three groups. Mean thyroid volume was significanly higher in the IFG (16.1 ± 4.2 cm3) and T2DM (19.4 ± 5.2 cm3) groups than in the controls (11.9 ± 3.7 cm3).
In T2DM group, there was a positive correlation between TSH and BMI (r = 0.43; p < 0.01), and between TSH and WC (r = 0.37; p < 0.01).
Multiple linear regression analysis was used for the assessment of independent predictors of thyroid volume (Table 2).
Age, WC, IFG diagnosis, and T2DM diagnosis remained independently correlated with thyroid volume (β = 0.11, P = 0.003; β = 0.28, P < 0.001; β = 0.36, P < 0.001; β = 0.52, P < 0.001, respectively). 
Predictors of thyroid nodule formation were assessed by multivariate binary logistic regression analysis (Table 3). 
In the multivariate model, age, IFG diagnosis, and T2DM diagnosis remained independently correlated with thyroid volume (β = 0.11, P = 0.001; β = 0.28, P < 0.001; β = 0.36, P < 0.001; β = 0.52, P < 0.001, respectively). Predictors of thyroid nodule formation were assessed by multivariate binary logistic regression analysis (Table 3). In the multivariate model, age, IFG diagnosis, and T2DM diagnosis remained independently correlated with thyroid nodule formation (β = 0.04, P = 0.025; β = 1.09, P < 0.001; β = 1.53, P < 0.001, respectively). The odds ratios for the development of thyroid nodule in the presence of IFG and T2DM were 3.01 and 4.65, respectively. These results provide evidence that IFG and T2DM is an independent risk factor for thyroid nodule formation. 

Discussion

Type 2 DM and thyroid disorders are two commonly seen endocrinopathies in the adult population [9, 10]. It is well known that IR and compensatory hyperinsulinemia are the key factors in the pathogenesis of T2DM [11]. Area of research in thyroidology is the association of IR with thyroid functional and morphological abnormalities. Recent studies have shown consistent association of IR and thyroid morphological changes, raising the question of whether abnormality in glucose metabolism, which is a final consequence of IR, affects thyroid morphology [12, 13]. 
There have been only two studies of thyroid morphological changes among patients with T2DM. In the study [14], consecutive 98 type 2 diabetic and 30 type 1 diabetic patients were compared with 50 and 38 controls respectively, in terms of thyroid volumes, gland echogenicity, nodule prevalance, and TSH levels. Significant increases in median thyroid volume were observed in both subjects with T1DM and T2DM in comparison to their control groups. Moreover, thyroid nodules appeared more frequently in patients with T2DM than in their control group (48 % vs. 28 %, P < 0.02). Thyroid nodule prevalence was similar in patients with T1 DM and control group. TSH levels did not differ between T2DM and control cases; it was significantly lower than controls in T1DM patients, albeit witihin the normal range [14]. 
A direct comparison of these findings and our results is not possible because these investigators performed this study in an iodine replete area and in patients with poorly controlled DM and diabetic complications. Nonetheless, the results of our study, except TSH evaluations, are consistent with their findings, lending support to the notion that thyroid morphology is altered in patients with T2DM. 
There are multiple potential explanations for our findings. We determined the relation between IFG and thyroid morphology. We found that serum TSH level was significantly higher in patients with T2DM than in patients with IFG and in controls. Also, TSH level was significantly positively correlated with BMI and WC. Some humoral or hormonal mediators from adipose tissue stimulate the hypothalamus-pituitary-thyroid axis to increase TSH secretion [15]. 
There is evidence in the literature indicating that there is a possible relationship between leptin and the thyroid hormones via an influence of leptin on the negative (TRH) expression. Leptin may also act directly on TRH neurons through leptin receptors on these cells [16]. Serum leptin levels were found to be increased in T2DM [17]. Thus, increased fat mass along with IR in patients with T2DM may contribute to increased serum TSH levels via effects on serum leptin concentrations [18]. 
We found that patients with IFG and T2DM had larger thyroid volumes and higher risk for formation of thyroid nodules. TSH is a major regulator of the growth and differentiation of thyroid cells [19, 20]. The higher circulating levels of insulin in case of abnormal glucose metabolism may cause increased thyroid proliferation and thyroid nodules. 
Working on screening programs for thyroid morphology from the initial diagnosis of T2DM may provide early diagnosis, prevention, and timely treatment of nodular thyroid disease and thyroid cancer in patients with abnormal glucose metabolism. 
A limitation of the present study may be the lack of further information and comparison about some morphological characteristics of thyroid nodules such as nodule diameters and uni-/multinodularity in each group. 
The cytological and histopathological outcome of each thyroid nodule in the study groups has not been assessed according to the study design which is another important limitation. 
Including this assessment in such a prospective design may improve the strength of future studies. 

Conclusions

Mean TSH level in the T2DM (2.1 ± 0.9 mIU/l) group was significanly higher than the control group (1.4 ± 0.7 mIU/l) and the IFG group (1.5 ± 0.8 mIU/l) (P < 0.001 for both). Mean thyroid volume was significanly higher in the IFG (16.1 ± 4.2 cm3) and T2DM (19.4 ± ± 5.2 cm3) groups than in the controls (11.9 ± 3.7 cm3). 
In T2DM group, there was a positive correlation between TSH and BMI (r = 0.43; p < 0.01), and between TSH and WC (r = 0.37; p < 0.01).
Percentage of patients with thyroid nodules was also higher in the IFG (46.2 %) and T2DM groups (63.1 %) than in controls (18.4 %). 
The results suggest that patients with impaired glucose metabolism and type 2 diabetes mellitus have significantly increased thyroid volume and nodule prevalence. The risk of increased thyroid volume and nodule prevalence was found to be significantly elevated with increasing BMI and abnormal glucose metabolism. 
 
Received 02.06.2022
Revised 20.07.2022
Accepted 03.08.2022

Список литературы

  1. Grani G., Sponziello M., Pecce V., Ramundo V., Durante C. Contemporary Thyroid Nodule Evaluation and Management. J. Clin. Endocrinol. Metab. 2020. 105(9). 2869-83. doi: 10.1210/clinem/dgaa322. 
  2. Demiral Sezer S., Erdoğan Yücel E. Does insulin resistance trigger thyroid nodule? Intern. Emerg. Med. 2021. 16(8). 2105-2108. doi: 10.1007/s11739-021-02713-z. 
  3. Tang Y., Yan T., Wang G., Chen Y., Zhu Y., Jiang Z. et al. Correlation between Insulin Resistance and Thyroid Nodule in Type 2 Diabetes Mellitus. Int. J. Endocrinol. 2017. 2017. 1617458. doi: 10.1155/2017/1617458. 
  4. Aydoğan Y., Altay M., Ünsal O., Kaplanoğlu V., Çağır Y., Yıldız C. et al. An assessment of the relationship between thyroid nodule characteristics, insulin resistance and arterial stiffness in euthyroid nodular goiter. Endocrine. 2018. 62(2). 440-447. doi: 10.1007/s12020-018-1701-6. 
  5. Kalra S., Aggarwal S., Khandelwal D. Thyroid Dysfunction and Type 2 Diabetes Mellitus: Screening Strategies and Implications for Management. Diabetes Ther. 2019. 10(6). 2035-2044. doi: 10.1007/s13300-019-00700-4. 
  6. Haroon S.M., Khan K., Maqsood M., Iqbal S., Aleem M., Khan T.U. Exploring the Effect of Metformin to Lower Thyroid-Stimulating Hormone in Euthyroid and Hypothyroid Type-2 Diabetic Patients. Cureus. 2021. 13(2). e13283. doi: 10.7759/cureus.13283. 
  7. American Diabetes Association. 2. Classification and Diagnosis of Diabetes: Standards of Medical Care in Diabetes-2020. Diabetes Care. 2020. 43 (Suppl. 1). S14-S31. doi: 10.2337/dc20-S002. PMID: 31862745.
  8. Pasyechko N., Chukur O., Krytskyy T., Bob A. Iodine status of children and women of reproductive age in the Western region of Ukraine. International Journal of Endocrinology. 2019. 15(7). 541-547. https://doi.org/10.22141/2224-0721.15.7.2019.186057.
  9. Pankiv V.I., Yuzvenko T.Y., Pankiv I.V. Type 2 diabetes mellitus and subclinical hypothyroidism: focusing on the role of cholecalciferol. Problems of Endocrine Pathology. 2019. 68(2). 46-51. https://doi.org/10.21856/j-PEP.2019.2.07
  10. Mehalingam V., Sahoo J., Bobby Z., Vinod K.V. Thyroid dysfunction in patients with type 2 diabetes mellitus and its association with diabetic complications. J. Family Med. Prim. Care. 2020. 9(8). 4277-4281. doi: 10.4103/jfmpc.jfmpc_838_20. 
  11. Wondmkun Y.T. Obesity, Insulin Resistance, and Type 2 Diabetes: Associations and Therapeutic Implications. Diabetes Metab. Syndr. Obes. 2020. 13. 3611-3616. doi: 10.2147/DMSO.S275898. 
  12. Kazukauskiene N., Podlipskyte A., Varoneckas G., Mickuviene N. Insulin Resistance in Association with Thyroid Function, Psychoemotional State, and Cardiovascular Risk Factors. Int. J. Environ. Res Public Health. 2021. 18(7). 3388. doi: 10.3390/ijerph18073388. 
  13. Spira D., Buchmann N., Dörr M., Markus M.R.P., Nauck M., Schipf S. et al. Association of thyroid function with insulin resistance: data from two population-based studies. Eur. Thyroid J. 2022. 11(2). e210063. doi: 10.1530/ETJ-21-0063. 
  14. Junik R., Kozinski M., Debska-Kozinska K. Thyroid ultrasound in diabetic patients without overt thyroid disease. Acta Radiol. 2006. 47(7). 687-91. doi: 10.1080/02841850600806308. 
  15. Ortiga-Carvalho T.M., Chiamolera M.I., Pazos-Moura C.C., Wondisford F.E. Hypothalamus-Pituitary-Thyroid Axis. Compr. Physiol. 2016. 6(3). 1387-428. doi: 10.1002/cphy.c150027. PMID: 27347897.
  16. Rogers R.C., McDougal D.H., Hermann G.E. Leptin amplifies the action of thyrotropin-releasing hormone in the solitary nucleus: an in vitro calcium imaging study. Brain Res. 2011. 1385. 47-55. doi: 10.1016/j.brainres.2011.02.029. 
  17. Onyemelukwe O.U., Ogoina D., Onyemelukwe G.C. Leptin concentrations in type 2 diabetes and non-diabetes Nigerian-Africans. Am. J. Cardiovasc. Dis. 2020. 10(4). 444-454. PMID: 33224595; PMCID: PMC7675163.
  18. Yu H., Li Q., Zhang M., Liu F., Pan J., Tu Y., Lu J. et al. Decreased Leptin Is Associated with Alterations in Thyroid-Stimulating Hormone Levels after Roux-en-Y Gastric Bypass Surgery in Obese Euthyroid Patients with Type 2 Diabetes. Obes Facts. 2019. 12(3). 272-280. doi: 10.1159/000499385. 
  19. Chang Y.C., Hua S.C., Chang C.H., Kao W.Y., Lee H.L., Chuang LM. et al. High TSH Level within Normal Range Is Associated with Obesity, Dyslipidemia, Hypertension, Inflammation, Hypercoagulability, and the Metabolic Syndrome: A Novel Cardiometabolic Marker. J. Clin. Med. 2019. 8(6). 817. doi: 10.3390/jcm8060817. 
  20. Matti B., Cohen-Hallaleh R. Overview of the 2015 American Thyroid Association guidelines for managing thyroid nodules and differentiated thyroid cancer. N. Z. Med. J. 2016. 129(1441). 78-86. PMID: 27607088.

Вернуться к номеру