Інформація призначена тільки для фахівців сфери охорони здоров'я, осіб,
які мають вищу або середню спеціальну медичну освіту.

Підтвердіть, що Ви є фахівцем у сфері охорони здоров'я.


Коморбідний ендокринологічний пацієнт

Коморбідний ендокринологічний пацієнт

Международный эндокринологический журнал Том 18, №5, 2022

Вернуться к номеру

Валідність і надійність шкали оцінки ефективності лікування цукрового діабету в Туреччині

Авторы: Esin Kavuran (1), Nihan Türkoğlu (2)
(1) — Department of Nursing Fundamentals, Nursing Faculty, Ataturk University, Erzurum, Turkey Central Campus-Yakutiye-Erzurum, Turkey
(2) — Department of Public Health Nursing, Nursing Faculty, Ataturk University, Erzurum, Turkey

Рубрики: Эндокринология

Разделы: Клинические исследования

Версия для печати


Резюме

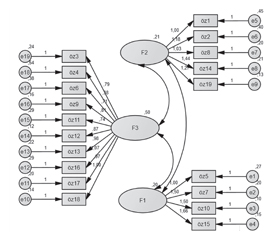
Актуальність. Проблема адаптації до лікування цукрового діабету (ЦД) перешкоджає досягненню компенсації, призводить до прогресування захворювання, а також до зростання витрат через хворобу. Аналіз ефективності лікування ЦД 2-го типу в Туреччині вказує на високу частку осіб з низьким рівнем комплаєнсу і компенсації ЦД. У дослідженні 1456 осіб із ЦД, які отримували інсулінотерапію, 29,7 % хворих повідомили, що вони не дотримуються призначеного режиму лікування. Мета: дослідження розроблено й проведено з метою вивчення валідності й надійності шкали оцінки ефективності лікування діабету (DMSS). Матеріали та методи. У дослідженні взяли участь 197 осіб, які перебували під спостереженням в амбулаторії університетської лікарні в період із травня по червень 2019 року. У них був діагностований ЦД принаймні один рік тому, і хворі погодилися брати участь у дослідженні. Для перевірки надійності (внутрішньої узгодженості) шкали оцінки ефективності медикаментозного лікування ЦД використовувався метод альфа Кронбаха. Результати. У результаті аналізу було встановлено, що шкала складається з 19 пунктів і трьох підпунктів. Значення альфа Кронбаха для всієї шкали та її підшкал становили 0,94; 0,89; 0,85 і 0,93 відповідно. Для перевірки 3-факторної структури шкали було проведено підтверджуючий факторний аналіз. Згідно з результатами підтверджуючого факторного аналізу, χ2/SD = 3,22 виявився меншим за прийнятне контрольне значення 5. Цей результат показує, що дані сумісні з моделлю. Крім того, інші результати були такими: RMSEA = 0,070; PNFI = 0,82; CFI = 0,99; RMR = 0,27; GFI = 0,94; AGFI = 0,88 і PGFI = 0,61. Висновки. Валідну, перевірену й стандартизовану 19-пунктову 5-бальну шкалу типу Лайкерта можна використовувати для визначення оцінки ефективності лікування хворих на цукровий діабет у популяції.

Background. As the problem of adaptation to diabetes management in chronic diseases prevents the success of treatment, it causes the disease process to progress negatively, other diseases and deaths to develop and the costs of the disease to increase. Type 2 diabetes mellitus treatment in Turkey concerns the rate of indivi­duals with low compliance and continuity of the disease. In a study of 1,456 individuals with diabetes treated with insulin throughout Turkey, 29.7 % of patients reported that they did not adhere to the prescribed drug regimen. This study was designed to investigate the validity and reliability of the Diabetes Medication Self-Efficacy Scale. Materials and methods. The study was constituted with 197 individuals, who admitted to endocrinology outpatient clinic of a University Hospital between May and June 2019, and had diabetes diagnosis for at least one year and agreed to participate in the research. The descriptive and confirmatory factor analysis and Cronbach’s alpha internal consistency analysis were used during the Turkish adaptation phase of the Diabetes Medication Self-Efficacy Scale. Results. As a result of the analysis, the scale was determined to be consisted of 19 items and three sub-dimensions and explained 68.472 % of the total variance. Cronbach’s alpha values for the whole scale and its sub-scales were 0.94, 0.89, 0.85, and 0.93, respectively. Confirmatory factor analysis was performed to verify the 3-factor structure of the scale. According to the confirmatory factor analysis results, χ2/SD = 3.22 was found to be less than the acceptable reference value of 5. This finding shows that the data are compatible with the model. In addition, the other results were as follows: RMSEA = 0.070, PNFI = 0.82, CFI = 0.99, RMR = 0.27, GFI = 0.94, AGFI = 0.88 and PGFI = 0.61. When we look at these values, they are appeared to be in good alignment. Conclu­sions. This reliable, validated and standardized 19-item 5-point Likert type scale can be used to determine the medication self-efficacy for patients with diabetes in society.


Ключевые слова

цукровий діабет; медикаментозне лікування; ефективність; шкала оцінки

diabetes mellitus; medication; self-efficacy; validity; reliability

Introduction

The prevalence of diabetes mellitus is rising rapidly with the change in lifestyle due to population growth, aging and urbanization [1]. DM is a serious, long-term condition with a major impact on the lives and well-being of individuals, families, and societies worldwide. It is among the top 10 causes of death in adults, and was estimated to have caused four million deaths globally in 2017 and global health expenditure on diabetes was estimated to be USD 727 billion. [2]. As DM is the problem of adaptation to treatment in chronic diseases prevents the success of treatment, it causes the disease process to progress negatively, other diseases and deaths to develop and the costs of the disease to increase [3]. Numerous easy-to-use and effective drugs for the treatment of DM in recent years low level of drug compliance in patients the effectiveness of clinical outcomes is limited. [4]. 
A patient with DM usually has other diseases that accompany diabetes. Therefore, the patient needs to use a large number of drugs in order to achieve both glycemic goals and clinical targets related to other diseases. His ultimate goal compliance with this complex regimen, which is to ensure the well-being of the patient [5]. Usually in chronic diseases, non-compliance with treatment develops with the idea that the drug is not effective in quitting the drug as a result of side effects or in improving the disease and reducing the symptoms of the disease [6]. In DM, drug mismatch is mostly due to the idea that when symptoms are not present, there is no need to use the drug [7]. 
Literature research has shown that low treatment compliance and continuity is an important issue for individuals with DM worldwide [8]. A series of systematic assessments and meta-analyses of DM treatment compliance and continuity were conducted around the world [8, 9] and 27 studies of these, the most recent meta-analysis found that the proportion of individuals with DM without treatment compliance was between 6.9 % and 61.5 %, and the average was 37.7 % [9]. Type DM treatment in Turkey concerns the rate of individuals with low compliance and continuity of diabetes. In a study of 433 individuals with DM treated with insulin, 40.4 % of people reported non-compliance with daily insulin use in 20.3 % [10]. In a study of 1456 individuals with diabetes treated with insulin throughout Turkey, 29.7 % of patients reported that they did not adhere to the prescribed drug regimen [11]. In an international study involving 154 individuals with Turkish patients (treated with insulin), 24.1 % of them reported that they did not adhere to the prescribed drug regimen [12]. From this point of view, the aim of this study is to study the Turkish validity and reliability of the drug self-efficacy scale for diabetic patients.

Materials and methods

Study design: The aim of this methodological-type study was to translate and validate the Diabetes Medication Self-Efficacy Scale to Turkish.
Inclusion and exclusion criteria: being 18 years or older; diagnosed with type 2DM for at least six month; were on dia–betes medication; could speak, read, and write in Turkish.
Sampling and sample size determination: the study population was made up of all patients with type 2 DM who attended the endocrinology clinics in public hospital within the study area. In scale studies, the sample size was calculetes as follows “number of items x number of patients per items”. The sample size is required to be at least 5–10 times bigger than the number of items in the scale which the validity and reliability was tested [13]. There were 19 items in the developed scale and the sample of the study consists of 197 diabetic patients. 
The Data collection: the study data was collected by two researcehes after ethical approval. During collecting data, the aim of study and procedures were explained to patient with type 2 DM by both formal and verbal explanations and a consent form was signed. They were informed that they were free to withdraw from the study at any time. Participants responded to the questionnaire items between 10 and 15 minutes.
Instrumentation: two instruments were used to collect of study data; Demographic Characteristics Form and Diabetes Medication Self-Efficacy Scale. Demographic Form consisted of 12 questions such as age, gender, education level, job, marital status, income level, and family history of DM. 
Diabetes medication self-efficacy scale that was developed by Sleathe and colluges included 19 items to assess self-efficacy in overcoming barriers that might interfere with the use of diabetes medications [14]. Scores on the diabetes medication adherence scale ranged from 19 (lower self-efficacy) to 57 (higher self-efficacy). 
Data analysis: the SPSS 23.0 and Lisrel 8.50 packaged software (SPSS Inc., Chicago, IL, USA) was used for analysis of data. Descriptive analysis were performed to examine demographic characteristics of the participants and mean and standard deviations were for continuous data. In the study, basic components analysis was performed for providing more accurate findings. Lisrel software packages were used to assess the data and to test the structural validity. In the study, basic components analysis was performed for providing more accurate findings. Kaiser-Meyer-Olkin (KMO) and Bartlett’s tests were applied before the factor analysis in order to determine the sample adequacy and the convenience to factor analysis. Following all these procedures, convenience of the model for theoretical structure was evaluated with the Lisrel program. Fit indices like χ2/sd, GFI, AGFI, CFI, RMSEA and SRMR were used in this stage. The internal validity was determined using the Cronbach’s α coefficient, item-total score. 
Ethical considerations: the study was approved by the Committee of Nursing Faculty and Before starting the study, permission via e-mail was obtained from Betsy Sleathe who developed the scale.

Results

Condent Validity: the scale which has been translated to evaluate the validity of the scope, has been submitted to the opinion of six experts. The scope validity index for condent validity is determined by the Davis technique. The experts were asked to evaluate each item in terms of language conformity, clarity and comprehension to the Turkish society by scoring between 1–4 (1 = very appropriate, 2 = appropriate but minor change required, 3 = article needs to be properly shaped, 4 = not suitable). When evaluating each item, the number of experts selected by selecting (a) or (b) is divided by the total number of experts, and a value of 0.80 for the content validity Index (KGI) for each item is considered criteria. In this study, no items were removed because there were no items below 0.80.
Reliability Analysis: items analysis and internal consistency Cronbach Alpha reliability analysis were performed for 19 items on the scale. Table 1 shows the item-total score correlations of the scale. The total correlations of the scale range from 0.36 to 0.81. The item was not removed because there was no change in the Cronbach alpha values when the item was removed, which was below 0.30 in the total score correlation of the item within the scale (Table 1).
Cronbach Alpha, the internal consistency reliability coefficient of the scale, is 0.94. Cronbach Alpha, the reliability coefficients of each subscale of the scale; 0.89, 0.85, 0.93 (Table 2).
Test-Retest: in order to determine the reliability of the scale, 52 people were tested and retested after two weeks. As shown in Table 3, the correlation value for the relationship between the first and second measurement results is r = 0.752 and it is seen to be significant at p < 0.001. This finding indicates that the first and second measurement results of the scale applied two weeks apart are similar.
Validity Analysis: in order to determine whether the data can be applied for factor analysis, the KMO coefficient applied and it has been found as 0.817. To determine whether the relationships between the variables and different from zero, Bartlett test applied and it has been found significant (p < 0.001) (Table 4). Based on these findings, basic components analysis and varimacary rotation method were applied from descriptive factor analysis methods to reveal the factor structure of the scale consisting of 19 items, and a three-factor structure with a self-worth of over 1.00, explaining 68 % of the total variance after factor analysis (Table 4). Factor loads of the items were found to be between 0.54 and 0.90. When the factor structure of the scale was examined, 18.472 % of the total variance was explained by 1st factor and 16.610 % by 2nd factor and 33.391 % by 3rd factor. It was determined that the total variance for all factors was 68.472 %. According to the results of the Confirmatory Factor Analysis, the χ2/sd = 3.22 and was less than ≤ 5 with an acceptable reference value. This finding indicates that the data was compatible with the model. Additionally, RMSEA = 0.070, PNFI = 0.82. CFI = 0.99, RMR = 0.27. GFI = 0.94. AGFI = 0.88 and PGFI = 0.61. It was seen that they were at a good level. 
In the study, the scale total scores was compared with patients’ gender, marital status, other disease status and drug taking; no statistically significant difference was found (p > 0.05). The scale total score of patient having high school, higher education status, who were student, who perceiving their health level as excellent and who goes to the hospital once a month was found to be significantly higher (p < 0.05) (Table 5).

Discussion

Content validity relates to what extend the scale, as a complete unity or as one of its items, can serve this objective [15, 16]. Referring to an expert opinion is one of the methods utilized to determine content validity [17]. I. Erefe (2002) claims that in determining content validity preliminary draft should be examined by a group of minimum 3 experts and it is essential to form a consensus upon an independent analysis [18]. 
To test its content validity, Diabetes Medication Usage Self-Efficacy Scale form was designed and submitted to the approval of six experts. Six experts in charge of item assessment then offered their views in accordance with Davis technique and within the framework of their proposal validity indices of item contents were computed to be between 0.84 to 1.00 values. Based on the criteria value 0.80 suggested by H. Yurdugül and F. Bayrak (2012), it is evidenced by the obtained result that there has been consensus among experts [19].
Reliability is the preliminary condition of scale validity [20]. There are various methods related to the way reliability can be determined and in here Cronbach’s Alpha value draws attention because rather than multiple applications it manifests to what level one measurement is consistent wit–hin itself [13]. If this Alpha coefficient remains between 0.00 to 0.40, scale is not deemed reliable. If Alpha value is between 0.40 to 0.60 values there is low reliability; if between 0.60 to 0.80 scale is highly reliable and if between 0.80 to 1.00 it is significantly reliable [20]. In this particular study Alpha values varied from 0.85 to 0.93. In the original scale internal consistency is (Cronbach’s Alpha) 0.86. 
In the Chinese version of the scale, on the other hand, Cronbach’s Alpha reliability coefficient is 0.94 and according to these results, in terms of internal consistency, the scale is in a highly good level. Besides for the scale items total test correlation analysis was conducted and in here, the aim is to measure discriminatory power of the items. If the item is found to be discriminative it should be integrated within the scale [20]. If corrected item-total correlation coefficient is below 0.20, items should be excluded from measurement tool but if the said coefficient is between 0.20 to 0.30 items can be integrated to the required measurement tool, if the value is 0.30 or above, items are good [21]. 
Diabetes Medication Usage Self-Efficacy Scale in Table 1 puts forth that item-total score correlation varies from 0.36 to 0.81 and in our research too, it was detected that none of the items was below 0.30. Hence none of the items was excluded from the scale.
Measurement tool’s power to remain unchanged with respect to time and its power to provide consistent results in every application is described as test-retest reliability [22]. Literature review suggests that in a test application, minimum number of required participants is 30 [23, 24]. In this study the scale was re-administered to 52 people two weeks after. In the conducted test-retest analysis, measuring r = 0.752 correlation between the first and second application scores and presence of a statistically significant and positive relationship (p < 0.05) between two measurements proves that there is consistency between measurements. In the Chinese version of the scale, test retest reliability coefficient was computed as 0.76 [25]. In the aftermath of repeated measurements if the correlation value is in a good level and there is significant difference, the scale is considered as reliable.
In order to conduct validity analyses, basic components analysis in the scale and Varimax rotation method were administered. The reason for employing this analysis and method is to determine if the scale is structurally valid and to manifest its factor structure. In literature, it is reported that if the aim is to generalize the results of factor analysis it is required to collect minimum five or ten times more data than the total quantity of items or as per the total sum of people or variable to collect, observation ratio must be between 1 : 10 to 1 : 20 [20]. In the study, by examining minimum 5 to 10 times more numbers of data (197) than total quantity of items, factor analyses were employed. On the other hand Barlett test and KMO test were also administered and the aim in that is to determine if data are fit with compatible features for factor analysis in terms of application and if relationships between variables are significant or not and divert from zero. If KMO value is above 0.60 it is agreed that factor analysis is good [26]. For this particular study, KMO value was measured as 0.817 and according to this finding, sampling size of factor analysis is sufficient. As the test is analyzed within the framework of factor analysis, it is noticeable that correlation structure is fit and sampling size is also sufficient [21, 26]. Moreover, we can also feasibly argue that according to this finding, the data are compatible with respect to factor analysis.
Although construct validity can be determined via several different methods, the most widely utilized one is Exploratory Factor Analysis. Degrading of the total sum of items in the scale into subcategories can establish the targeted objective for factor analysis. Different groups are established when the items measuring the same factor unite. Via considering the features of items integrated within its formation, every factor group is named after a factor [18, 21]. Diabetes Medication Usage Self-Efficacy Scale is a 3-factor structure. In this scale, eigenvalues related to examining a 3-factor scale are 3.510 in the first factor, 3.156 in the second factor and 6.344 in the third factor (Table 4). Literature studies suggest that at the end of factor analysis, factor loads should be 0.30 and above [26]. In this study factor load of the items varies from 0.54 to 0.90. Likewise, in the Chinese version of the same scale too, factor loads were reported to be in between 0.72 and 0.85 [25]. According to these findings it can be argued that factor loads of the scale are in an acceptable level.
In an attempt to determine if 3-factor structure of the scale will be confirmed or not Confirmatory Factor Analysis (CFA) was administered and obtained results in CFA displayed that χ2/sd = 3.22 and p = 0.000. χ2 results test the data fitness of the model and reveal that obtained data are fit with the model. In the same vein, these finding also suggest that data are fit with the model.
In literature it is stated that acceptable fitness value for GFI, CFI indices is 0.90, perfect fitness value is 0.95 and above. It has been reported that acceptable fitness value of AGFI index is 0.85, perfect fitness value is 0.90 and above ranges of value [27–30]. For RMSEA and RMR indices, acceptable fitness value is reported as < 0.08 and perfect fitness value as < 0.05.
Some of the fitness index results of the Turkish version of the scale were determined as RMSEA = 0.070, PNFI = 0.82, CFI = 0.99, RMR = 0.27, GFI = 0.94, AGFI = 0.88 and PGFI = 0.61 and these values indicate that the scale is in a good fitness level. All these findings collectively suggest that model-data fitness is in an acceptable level. In another saying, we can argue that a three-factor model is fit and construct validity of the scale is ensured (Figure 1). 
In Table 5 we can see the comparison between descriptive features of the participants and mean scores of the scale. It has been detected that in parallel with the increased education level of participants, there is a corresponding climb in their self-efficacy level in diabetic medication usage. In literature, it has been stated that one of the most effective factors that can determine self-efficacy in the management of DM is education level [31–33]. Which is an expected finding because as humans become more educated, they can attain knowledge more easily and their management in medication usage also improves much higher. Diabetic patients are more responsible in matters related to their health and can put their learnings more effectively into daily practice.
In our study another salient factor impacting self-efficacy perception related to diabetic medication usage is perceived health condition of the patients. In our study, after analyzing the relationship between perceived health condition of the patients and mean scores from self-efficacy scale, it was detected that perceived health condition played a role in the mean score related to self-efficacy on diabetic medication usage. Self-efficacy scale mean score of the patients whose perceived health condition is good is higher than those patients whose perceived health condition is bad. Similarly in the study of Ö. Erol it was identified that perceived health affected their self-efficacy perception whereas as patients’ perceived health level went down, there was a responding fall in the self-efficacy scale mean score related to diabetes management [34]. These data are on par with our finding in this research.

Conclusions

In conclusion, by using language validity and content validity as the validity analysis. By administering internal consistency analyses, item analyses and test-retest methods as for the reliability analyses it was ascertained that Diabetes Medication Usage Self-Efficacy Scale is a valid and reliable tool that can be used among type 2 diabetic patients in Turkey.
Acknowledgments. The authors wish to thank all the participants in the study.
 
Received 23.06.2022
Revised 29.07.2022
Accepted 02.08.2022

Список литературы

  1. Sun H., Saeedi P., Karuranga S., Pinkepank M., Ogurtsova K., Duncan B.B., Stein C. et al. IDF Diabetes Atlas: Global, regional and country-level diabetes prevalence estimates for 2021 and projections for 2045. Diabetes Res Clin. Pract. 2022. 183. 109119. doi: 10.1016/j.diabres.2021.109119. 
  2. Khan M.A.B., Hashim M.J., King J.K., Govender R.D., Mustafa H., Al Kaabi J. Epidemiology of Type 2 Diabetes  Global Burden of Disease and Forecasted Trends. J. Epidemiol. Glob. Health. 2020. 10(1). 107-111. doi: 10.2991/jegh.k.191028.001. 
  3. Jiang C., Wang Q. Analysis of Influencing Factors for Chronic Diseases: A Large Sample Epidemiological Survey from Liaoyang. Comput. Math. Methods Med. 2022. 2022. 1537906. doi: 10.1155/2022/1537906. 
  4. Deters M.A., Laven A., Castejon A., Doucette W.R., Ev L.S., Krass I., Mehuys E. et al. Effective Interventions for Diabetes Patients by Community Pharmacists: A Meta-analysis of Pharmaceutical Care Components. Ann. Pharmacother. 2018. 52(2). 198-211. doi: 10.1177/1060028017733272. 
  5. American Diabetes Association Professional Practice Committee, Draznin B., Aroda V.R., Bakris G., Benson G., Brown F.M., Freeman R., Green J. et al. 6. Glycemic Targets: Standards of Medical Care in Diabetes-2022. Diabetes Care. 2022. 45 (Suppl. 1). S83-S96. doi: 10.2337/dc22-S006.
  6. Wormall S., Abbot S. Primary care clinical pharmacists and chronic disease medication adherence. Br. J. Gen. Pract. 2021. 71(712). 496. doi: 10.3399/bjgp21X717485. 
  7. Blaslov K., Naranđa F.S., Kruljac I., Renar I.P. Treatment approach to type 2 diabetes: Past, present and future. World J. Diabetes. 2018. 9(12). 209-219. doi: 10.4239/wjd.v9.i12.209. 
  8. Kumar A., Hejmady D.I., Thapar R., Kumar N., Holla R., Shetty V et al. Are Our Diabetic Patients Adherent to the Treatment? Curr. Diabetes Rev. 2021. 17(8). e022221191731. doi: 10.2174/1573399817666210223114010. P
  9. Krass I., Schieback P., Dhippayom T. Systematic Review or Metaanalysis Adherence to diabetes medication: a systematic review. Diabetic Medicine. 2015. 32. 725-37. DOI: 10.1111/dme.12651.
  10. Yavuz D.G., Ozcan S., Deyneli O. Adherence to insulin treatment in insulin-naïve type 2 diabetic patients initiated on different insulin regimens. Patient. Prefer. Adherence. 2015. 9. 1225-31. doi: 10.2147/PPA.S87935. 
  11. Yavuz D.G., Bilen H., Sancak S., Garip T., Hekimsoy Z., Sahin I. et al. Impact of telephonic interviews on persistence and daily adherence to insulin treatment in insulin-naïve type 2 diabetes patients: dropout study. Patient Prefer. Adherence. 2016. 10. 851-61. doi: 10.2147/PPA.S100626. 
  12. Peyrot M., Barnett A.H., Meneghini L.F., Schumm-Draeger P.M. Insulin adherence behaviours and barriers in the multinational Global Attitudes of Patients and Physicians in Insulin Therapy study. Diabet. Med. 2012. 29(5). 682-9. doi: 10.1111/j.1464-5491.2012.03605.x. 
  13. Erkuş A. Mismatch between the meanings of turkish equivalents of psychometric terms and the processes performed. Journal of Measurement and Evaluation in Education and Psychology. 2010. 1(2). 72-7.
  14. Sleath B., Carpenter D.M., Blalock S.J., Davis S.A., Hickson R.P., Lee C., Ferreri S.P. et al. Development of a new diabetes medication self-efficacy scale and its association with both reported problems in using diabetes medications and self-reported adherence. Patient Prefer. Adherence. 2016. 10. 1003-10. doi: 10.2147/PPA.S101349. 
  15. Erdim L., Ergün A., Kuğuoğlu S. Reliability and validity of the Turkish version of the Physical Activity Questionnaire for Older Children (PAQ-C). Turk. J. Med. Sci. 2019. 49(1). 162-169. doi: 10.3906/sag-1806-212. 
  16. Altan L., Çeliker R., Ercan İ., Birtane M., Akgün K., Zateri C. et al. The reliability and validity of the Turkish version of the Fibromyalgia Participation Questionnaire. Eur. J. Rheumatol. 2018. 5(1). 40-44. doi: 10.5152/eurjrheum.2017.16090. 
  17. Sangwan A., Sangwan A., Punia P. Development and Validation of an Attitude Scale towards Online Teaching and Learning for Higher Education Teachers. TechTrends. 2021. 65(2). 187-195. doi: 10.1007/s11528-020-00561-w. 
  18. Erefe İ. (Ed.) Research principles, processes and methods in nursing. İstanbul: Odak Offset; 2002. 169-88.
  19. Yurdugül H., Bayrak F. Valitidy validation measures in scale development studies: Comparison of scope validity index and Kappa statistics. Hacettepe University Faculty of Education Journal. 2012. 2. 264-71. 
  20. Otieno-Odawa C.F., Kaseje D.O. Validity and reliability of data collected by community health workers in rural and peri-urban contexts in Kenya. BMC Health Serv. Res. 2014. 14 (Suppl 1). S5. doi: 10.1186/1472-6963-14-S1-S5. 
  21. Tolchard B. Reliability and Validity of the Work and Social Adjustment Scale in Treatment-Seeking Problem Gamblers. J. Addict. Nurs. 2016. 27(4). 229-233. doi: 10.1097/JAN.0000000000000141. 
  22. Tavşancil E. Measurement of attitudes and data analysis with SPSS. Ankara: Nobel Publishing; 2002.
  23. Guetterman T.C. Basics of statistics for primary care research. Fam. Med. Community Health. 2019. 7(2). e000067. doi: 10.1136/fmch-2018-000067. 
  24. Cartagena-Ramos D., Fuentealba-Torres M., Rebustini F., Leite A.C.A.B., Alvarenga W.A., Arcêncio R.A. et al. Systematic review of the psychometric properties of instruments to measure sexual desire. BMC Med. Res Methodol. 2018. 18(1). 109. doi: 10.1186/s12874-018-0570-2. 
  25. Zheng J., Wang Y., Ye X., Xiao L., Ye J., Li X., Zhong M. Validation of diabetes medication self-efficacy scale in Chinese with type 2 diabetes. Patient Prefer. Adherence. 2018. 12. 2517-2525. doi: 10.2147/PPA.S170144. 
  26. Ali Z., Bhaskar S.B. Basic statistical tools in research and data analysis. Indian J. Anaesth. 2016. 60(9). 662-669. doi: 10.4103/0019-5049.190623. 
  27. Erkorkmaz Ü., Etikan D., Demir O., Özdamar K. Sanisoğlu SY. Confirmatory factor analysis and fit indices: review. Turkiye Klinikleri J. Med. Sci. 2013. 33(1). 210-23. DOI:10.5336/medsci.2011-26747.
  28. Bajpai S.R., Bajpai R.C. Goodness of measurement: reliability and validity. International Journal of Medical Science and Public Health. 2014. 3(2). 112-5. DOI: 10.5455/ijmsph.2013.191120133.
  29. Stein C.M., Morris N.J., Hall N.B., Nock N.L. Structural Equation Modeling. Methods Mol. Biol. 2017. 1666. 557-580. doi: 10.1007/978-1-4939-7274-6_28. 
  30. Atkinson T.M., Rosenfeld B.D., Sit L., Mendoza T.R., Fruscione M., Lavene D. et al. Using confirmatory factor analysis to evaluate construct validity of the Brief Pain Inventory (BPI). J. Pain Symptom Manage. 2011. 41(3). 558-65. doi: 10.1016/j.jpainsymman.2010.05.008. 
  31. Yatim M.H., Wong Y.Y., Neoh C.F., Lim S.H., Hassali M.A., Hong Y.H. Factors influencing patients’ hypertension self-management and sustainable self-care practices: a qualitative study. Public Health. 2019. 173. 5-8. doi: 10.1016/j.puhe.2019.04.020. 
  32. Messina R., Rucci P., Sturt J., Mancini T., Fantini M.P. Assessing self-efficacy in type 2 diabetes management: validation of the Italian version of the Diabetes Management Self-Efficacy Scale (IT-DMSES). Health Qual Life Outcomes. 2018. 16(1). 71. doi: 10.1186/s12955-018-0901-3. 
  33. Bohanny W., Wu S.F., Liu C.Y., Yeh S.H., Tsay S.L., Wang T.J. Health literacy, self-efficacy, and self-care behaviors in patients with type 2 diabetes mellitus. J. Am. Assoc. Nurse Pract. 2013. 25(9). 495-502. doi: 10.1111/1745-7599.12017. Epub 2013 Mar 4. PMID: 24170654.
  34. Erol O., Enc N. Hypoglycemia Fear and Self-efficacy of Turkish Patients Receiving Insulin Therapy. Asian Nurs. Res (Korean Soc. Nurs. Sci). 2011. 5(4). 222-8. doi: 10.1016/j.anr.2011.12.001. 

Вернуться к номеру